Key socio-economic indicators reviewed (Part 2)
VGP – The positive socio-economic performance in 2013 marked hallmarks in GDP growth rates, IPI, business operation, total retail sales, FDI attraction, trade and CPI.
|
|
|
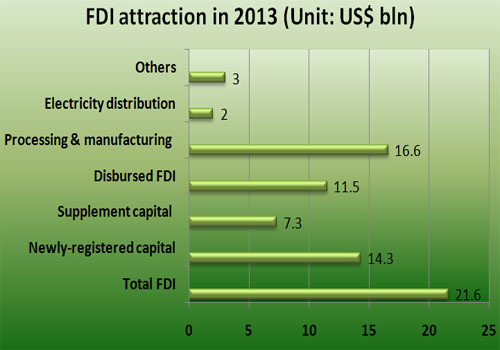
As of mid December 2013, Viet Nam attracted US$ 21.6 billion of FDI, year-on-year increase of 54.5% of which US$ 14.3 billion was invested into 1275 new projects and US$ 7.3 billion was added to 472 existing projects. The processing and manufacturing sector lured the biggest amount of FDI capital with US$ 16.6 billion (76.9% of total registered capital); followed by electricity production and distribution with US$ 2 billion (9.4%) and others US$ 3 billion (13.7%) – Source: The General Statistics Office |
|
|
|
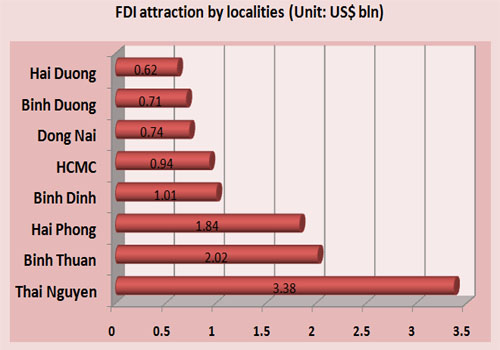
In 2013, 50 provinces and cities got FDI projects of which the northern province of Thai Nguyen attracted the biggest amount of registered FDI with over US$ 3.38 billion (23.7% of total newly-registered capital); followed by Binh Thuan with over US$ 2.02 billion (14.2%); Hai Phong US$ 1.84 billion (12.9%); Binh DInh over US$ 1.01 billion (7.1%) – Source: The General Statistics Office |
|
|
|
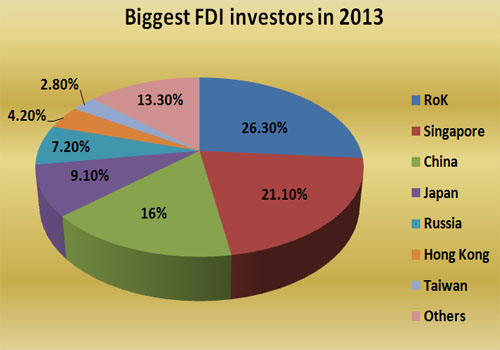
Out of 50 countries and territories investing in Viet Nam, the Republic of Korea took the lead with over US$ 3.75 billion (accounting for 26.3% of total FDI registered capital); followed by Singapore US$ 3.01 billion (21.1%); China US$ 2.27 billion (16%); Japan US$ 1.29 billion (9.1%); Russia US$ 1.02 billion; Hong Kong US$ 604 million (4.2%); Taiwan US$ 400 million (2.8%) – Source: The General Statistics Office |
|
|
|
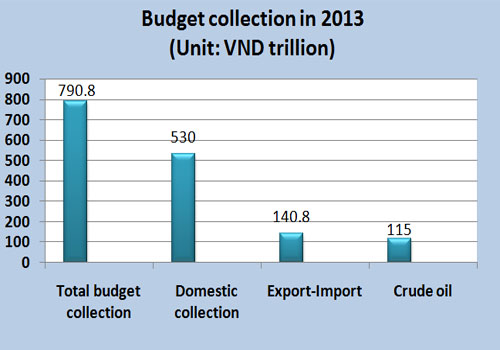
Total budget collection was estimated at VND 790.8 trillion of which domestic collection was VND 530 trillion; crude oil VND 115 trillion; export-import VND 140.8 trillion – Source: The General Statistics Office |
 |
|
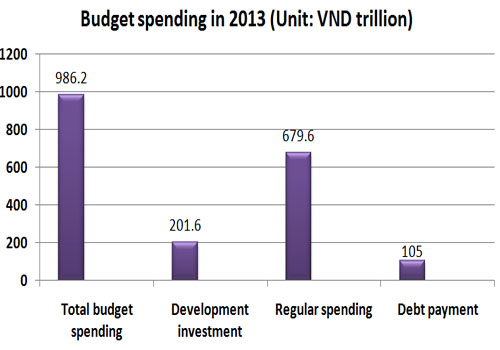
Total budget spending was estimated at VND 986.2 trillion, representing 100.8% of forecast. Development investment valued VND 201.6 trillion; spending on socio-economic development, national defense, security, management of the State, Party, and unions was VND 679.6 trillion and debt payment was worth VND 105 trillion – Source: The General Statistics Office |
|
|
|
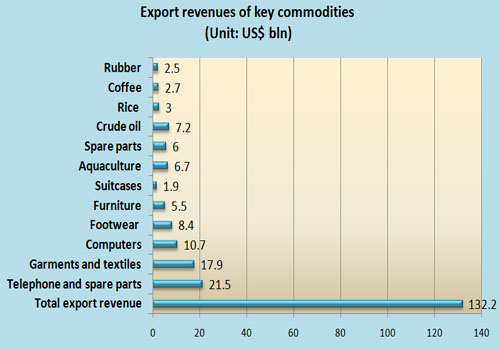
Export turnover valued US$ 132.2 billion, up 15.4% against 2012. Domestic sector earned US$ 43.8 billion in export turnover (up 3.5% against last year). FDI sector excluding crude oil pocketed US$ 88.4 billion (up 22.4%). In 2013, biggest hard currency earners included telephones and spare parts with US$ 21.5 billion (up 69.2%); garments and textiles US$ 17.9 billion (up 18.6%); and computers and spare parts US$ 10.7 billion (up 36.2%) – Source: The General Statistics Office |
|
|
|
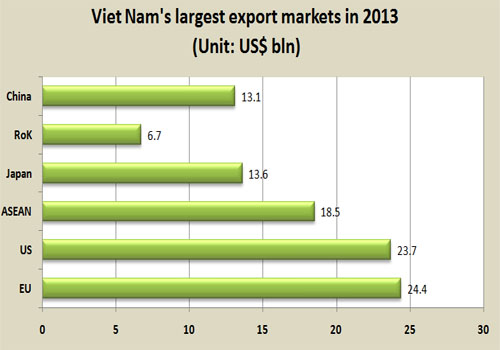
The EU was the largest importer of made-in-Viet Nam products with total export turnover of US$ 24.4 billion, up 20.4% against last year; followed by the US with export volume of US$ 23.7 billion (up 20.3%); ASEAN with US$ 18.5 billion (up 6.3%); Japan with US$ 13.6 billion (up 3.8%) and the RoK with US$ 6.7 billion (up 19.9%) – Source: The General Statistics Office |
|
|
|
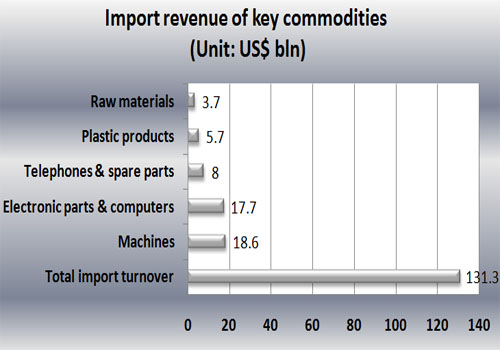
Total import turnover was worth US$ 131.3 billion, year-on-year increase of 15.4%. The domestic sector imported US$ 56.8 billion of goods (up 5.6%). The FDI sector imported US$ 74.5 billion of goods (up 24.2%). In 2013, Viet Nam chiefly imported machines and equipments with US$ 18.6 billion (up 16%); electronic products, computers and spare parts with US$ 17.7 billion (up 34.9%) – Source: The General Statistics Office |
|
|
|
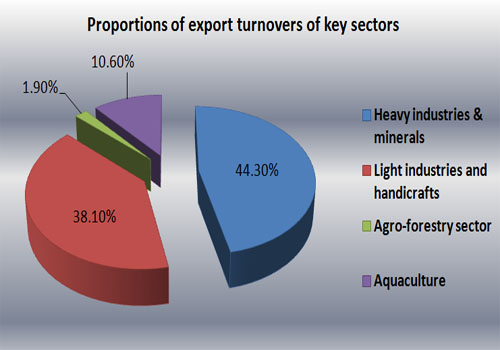
The export of heavy industries and minerals valued US$ 58.6 billion, up 21.5% against last year and occupying 44.3% of total export revenue. The light industries and handicrafts ranked the second place with US$ 50.3 billion, up 16.3% against last year. The agro-forestry sector shipped US$ 16.5 billion of goods abroad (down 1.9% against last year); aquaculture US$ 6.7 billion (up 10.6%) – Source: The General Statistics Office |
|
|
|
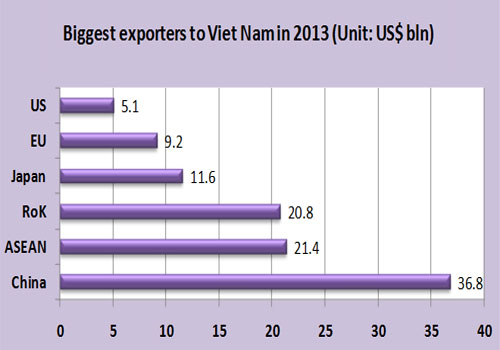
In 2013, Viet Nam chiefly imported US$ 36.8 billion of goods from China (up 26.7%); US$ 21.4 billion from ASEAN (up 2.8%); RoK US$ 20.8 billion (up 5.3%); Japan US$ 11.6 billion (down 0.18%); EU US$ 9.2 billion and the US$ 5.1 billion (up 6.1%) – Source: The General Statistics Office |
|
|
|
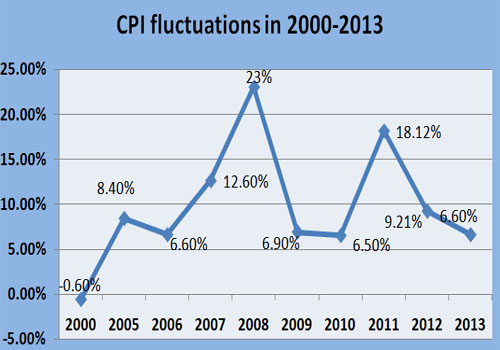
CPI picked up 6.6% in 2013, lower than the rate of 9.21% in 2012 – Source: The General Statistics Office |
By Huong Giang